The State of Online Shopping in Europe 2026: EuroPriceDrop's Cross-Country Deal Report
We track pricing, VAT, shipping and carrier data across 42 European markets for six platforms. This report is what that dataset actually shows — not survey estimates, our own tracked numbers, country by country, with the patterns that only show up once you compare all 42 side by side rather than looking at any single market in isolation.
Seven findings stood out enough to be worth publishing as their own report rather than folding into a single country page.
Finding one: VAT spans a six-fold range across markets we track
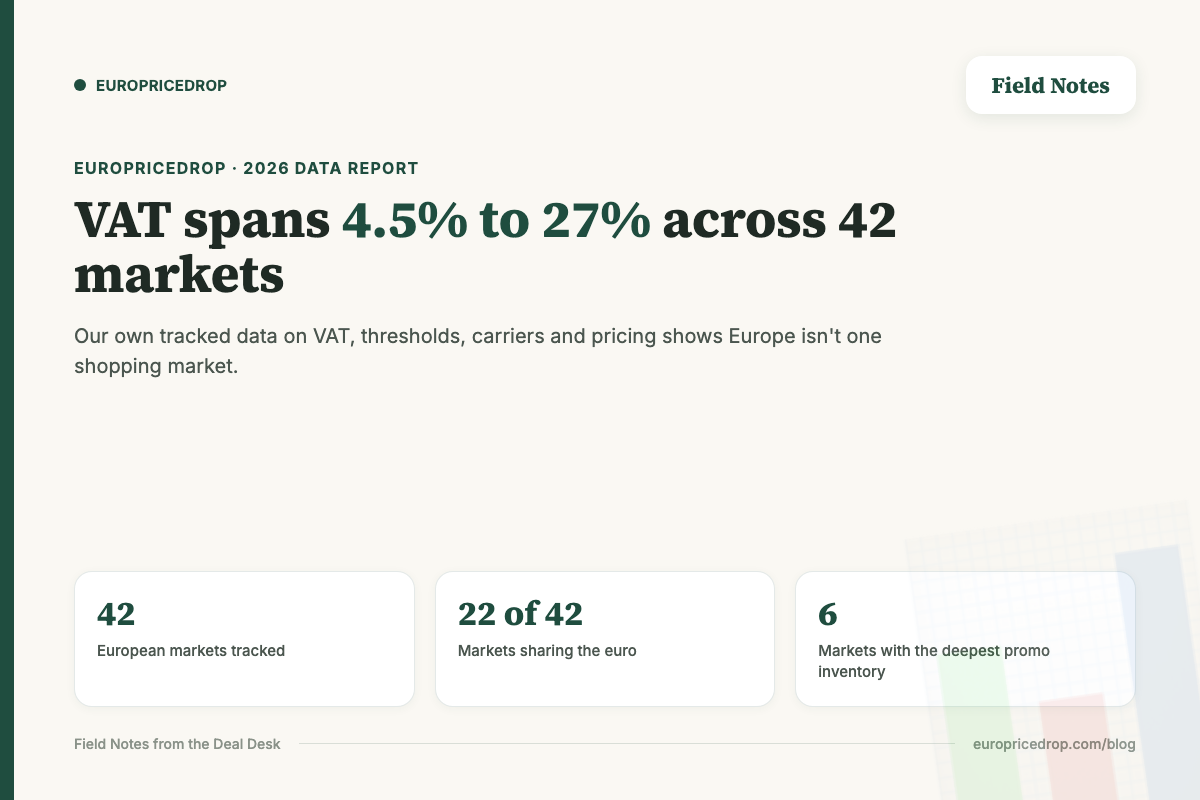
VAT ranges from 4.5% in Andorra to 27% in Hungary across the 42 markets we track — a genuinely wide spread that "average European VAT" statistics smooth over completely. Switzerland's 8.1% and Luxembourg's 17% sit at the low end; most of Western Europe clusters 19–22%.
| VAT range | Countries |
|---|---|
| Under 10% | Andorra (4.5%), Switzerland (8.1%) |
| 17–18% | Luxembourg, Bosnia, Georgia, Malta, North Macedonia, Azerbaijan |
| 19–20% | Germany, Romania, Cyprus, UK, France, Moldova, Serbia, Slovakia, Albania, Austria, Bulgaria, Ukraine, Armenia |
| 21–22% | Spain, Netherlands, Belgium, Latvia, Lithuania, Czechia, Montenegro, Italy, Estonia, Slovenia |
| 23%+ | Ireland, Poland, Portugal, Iceland, Finland, Greece, Denmark, Sweden, Croatia, Norway, Hungary (27%) |
Hungary’s 27% is the outlier on the high end by a real margin — nothing else we track breaks 25%. The practical implication: the same pre-VAT price lands meaningfully differently depending purely on delivery destination, which our shopping statistics by country piece covers from the shopper side rather than the aggregate-data side this report takes.
Finding two: over half our tracked markets share a currency, the rest don’t
22 of the 42 markets we track use the euro. The other 20 each run a separate currency — Swiss francs, Danish and Swedish and Norwegian kroner, Polish złoty, Hungarian forint, Ukrainian hryvnia, and more. This matters more than it sounds like it should: platforms pricing in local currency (rather than converting from a EUR or USD base) generally convert more cleanly, while platforms doing a live currency conversion at checkout can introduce a small but real markup that’s easy to miss if you’re not checking.
Finding three: free-shipping thresholds are more consistent than VAT
Comparing thresholds and codes across markets? We track live data for six platforms across every country.
See UK deals →Despite the VAT spread above, free-shipping thresholds for Temu cluster remarkably tightly once converted to a common currency — even across markets with completely different currencies and no shared VAT rate:
| Country | Temu threshold | Approx. EUR equivalent |
|---|---|---|
| UK | £20 | ~€23 |
| Germany | €25 | €25 |
| Georgia | ₾75 | ~€26 |
| Denmark | 175 kr | ~€23 |
| Switzerland | Fr.25 | ~€26 |
| Sweden | 275 kr | ~€24 |
| Poland | 100 zł | ~€23 |
| Hungary | 9,000 Ft | ~€23 |
That’s a roughly €23–26 band across eight markets with entirely different currencies, VAT rates, and purchasing-power levels — a tighter cluster than VAT, currency, or almost any other variable in this dataset. This is a platform-level pricing decision rather than a market-level one, and it’s part of why threshold-based basket planning (covered in our deal hunter’s playbook) works roughly the same way regardless of which country you’re shopping from.
Finding four: promo depth concentrates hard in six markets
Of the 42 countries we track, the UK, Germany, Spain, France, Italy and the Netherlands carry meaningfully deeper promo inventory — multiple stacked Temu codes, a live Klook partner code — than the other 36, which typically run on Temu’s single sitewide code plus auto-applied deals for the no-code brands. This isn’t a coverage gap on our end; it reflects where the platforms themselves concentrate promotional spend. Our best shopping websites piece covers platform-level comparison; this finding is specifically about where within Europe that comparison actually has the most live variation to compare.
Finding five: carrier density varies more than shoppers expect
We track two to four named delivery carriers per country, with three being the most common — but the specific carriers, and how many genuinely competitive options exist, differs by market in ways that affect real delivery reliability. Markets with four tracked carriers (Germany, Italy, Netherlands, Poland among them) generally show more consistent delivery windows than markets we track with only two, where a single carrier’s regional bottleneck has more impact on the whole country’s average delivery time.
Finding six: delivery windows split cleanly along warehouse lines, not geography
The intuitive assumption is that delivery time tracks distance — a market far from a warehouse hub should see slower shipping than one close by. Our tracked data doesn’t really support that. The much stronger predictor is warehouse origin (regional EU/UK stock vs. non-EU direct shipment), covered in depth in our Temu shipping times piece — two countries at similar distances from a hub can see meaningfully different delivery windows purely based on which warehouse tier a given order ships from, independent of the destination country’s own geography or infrastructure quality.
This matters for how we think about “slow” vs “fast” markets: it’s less about which country you’re in and more about which warehouse tier the platform routes your specific order through, which is influenced by product category and current stock levels as much as by destination.
Finding seven: local competitor density varies sharply by country
The number of genuine local competitors we track per country — the domestic retailers a brand page is implicitly competing against — ranges from two in the thinnest market we cover to five in the largest ones. The UK and Germany both carry five tracked local competitors across categories; most markets (29 of the 42) sit at four, with only one market thin enough to track just two. This isn’t a data-coverage artefact; it reflects real differences in how developed each country’s domestic e-commerce and retail sector is independent of the international platforms we track. Markets with denser local competition tend to also show more aggressive platform-level pricing, since Temu, Shein and the rest are competing against a fuller field rather than a thin one.
What this data can’t tell you
Worth being explicit about the limits here: this is pricing, VAT, threshold and carrier data, not a survey of actual purchase volume or consumer sentiment by country — we don’t have visibility into how many people are buying, only what the platforms charge and how they structure delivery once someone does. Anywhere this report makes a claim about behaviour rather than pricing structure, treat it as inference from checkout-side patterns, not measured survey data. That distinction matters, and it’s why this report leans on what we can verify directly (rates, thresholds, carrier counts) rather than extrapolating market-share percentages we can’t actually measure from where we sit.
What ties these seven findings together
The throughline across all seven: treating “Europe” as one online shopping market — one VAT rate, one currency, one promo depth, one delivery expectation, one competitive landscape — misses most of what actually determines your price and experience. Every one of these findings only becomes visible by comparing markets directly against each other, not by looking at any single country page in isolation, which is the entire reason we track country by country rather than publishing one generic European page per brand.
It’s also why a “best country to shop from” question doesn’t really have a single answer. The market with the lowest VAT (Andorra) isn’t the one with the deepest promo inventory (the flagship six). The market with the most tracked local competitors (UK, Germany) isn’t the one with the loosest free-shipping threshold. Each dimension moves somewhat independently of the others, which is exactly what you’d expect from 42 genuinely separate markets rather than one continent-wide system with local branding on top.
Methodology note
These findings come from our own tracked data across src/data/countries.ts and src/data/promos.ts — the same dataset that powers every country and brand page on this site — not from a third-party survey or industry report. VAT rates, currencies, and carrier lists are checked against each country’s own page as part of our regular update cycle; promo depth is measured by live code count per brand per country at time of writing. Numbers shift as codes rotate and new countries are added — treat this as a snapshot rather than a permanently fixed ranking.
FAQ
Which European country has the lowest VAT on online purchases? Andorra, at 4.5%, followed by Switzerland at 8.1% — both meaningfully lower than any EU member state we track.
Which country has the highest VAT? Hungary, at 27% — the only market we track that breaks 25%.
Do free-shipping thresholds vary as much as VAT does across Europe? No — they cluster far more tightly in local-currency-equivalent terms, since threshold levels are set by the platform rather than driven by each country’s VAT rate.
Why do some countries have deeper promo codes than others? Platforms concentrate promotional spend in their strongest markets — the UK, Germany, Spain, France, Italy and Netherlands carry the deepest tracked inventory among the 42 we cover, while other markets run primarily on sitewide codes and auto-applied deals.
Does distance from a warehouse determine delivery speed? Less than expected — warehouse tier (regional EU/UK stock vs. non-EU direct) predicts delivery time far more reliably than the destination country’s own geography or distance from any given hub.
Is this report based on survey data or your own tracked pricing? Our own tracked data — VAT rates, currencies, free-shipping thresholds and carrier lists checked against each country’s own page, not a third-party survey or industry estimate. See the methodology note above for what that does and doesn’t cover.
This report gets refreshed as our tracked data shifts — check our UK Temu page for the current live numbers behind these findings.