European E-Commerce Statistics: The Numbers Behind the Market
E-commerce now accounts for roughly a fifth of total retail sales across the EU and UK combined, with growth concentrated in cross-border purchases — shoppers buying from platforms based outside their own country, which is precisely the segment platforms like Temu, Shein and AliExpress have grown fastest in.
We track checkout and pricing data across every European market we cover, which gives us a working view of where the growth is actually landing, not just the headline market-size number.
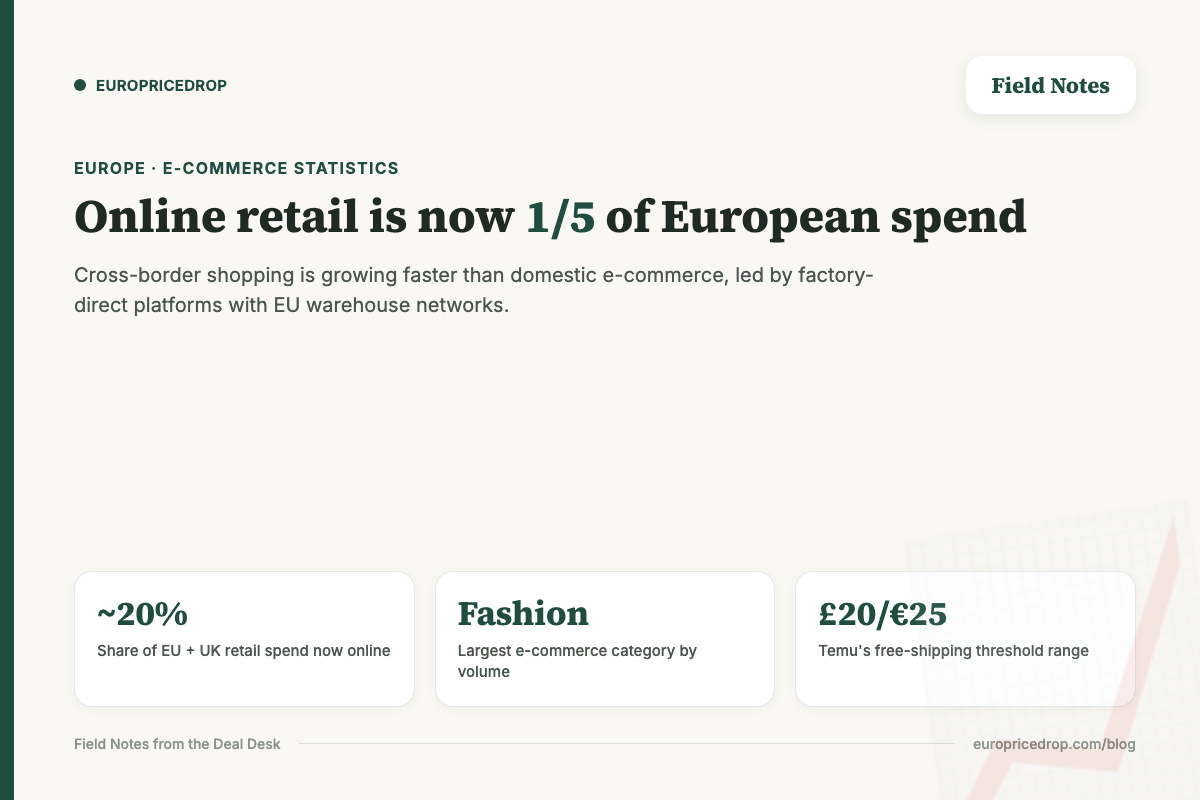
The headline numbers
Online retail represents roughly a fifth of total retail spend across Europe, growing faster in cross-border purchases than domestic ones. Mobile accounts for the majority of e-commerce traffic in nearly every market we track, though checkout completion still skews more toward desktop for higher-value purchases.
- Cross-border growth is outpacing domestic e-commerce growth — driven largely by factory-direct platforms (Temu, AliExpress, Shein) offering pricing domestic retailers can’t match.
- Mobile traffic dominates browsing in every market we track, though the mobile-to-desktop split at actual checkout narrows for purchases above roughly €50–100.
- Fashion remains the single largest e-commerce category by transaction volume, which is part of why Shein’s model — daily catalogue turnover, no-code auto-applied discounts — has scaled as fast as it has.
- Free shipping thresholds function as a real conversion lever — platforms that keep thresholds low (Temu’s £20/€25 range) see materially different basket-building behaviour than platforms with higher minimums.
Growth isn’t even across the continent
Western European markets (UK, Germany, France) have the highest absolute e-commerce spend, but growth rates are often steeper in markets that came to online shopping later — parts of Central and Eastern Europe are seeing faster year-on-year e-commerce growth than the largest Western markets, even though the absolute numbers remain smaller. This tracks with what we’ve seen expanding country coverage: newer markets often show stronger response to the same tracked codes than the more saturated, longer-established ones, likely because there’s less entrenched brand loyalty to a domestic retailer competing for the same basket.
VAT policy reshaped the numbers
The EU’s decision to close the low-value import exemption a few years back changed cross-border e-commerce measurably — it didn’t reduce cross-border shopping, but it shifted volume toward platforms with EU-based warehousing (AliExpress’s “Choice” program, Temu’s expanding regional network) that fold VAT into checkout cleanly, away from smaller sellers still shipping direct with less predictable landed costs. See our AliExpress warehouse shipping piece for how that plays out at the delivery-time level, not just the pricing level.
Want to see the pricing behind the numbers? We track live codes and thresholds across every market.
See UK deals →Payment method fragmentation is a persistent feature, not a bug
Unlike the US market, where card payment is close to universal, European e-commerce runs on a genuinely fragmented payment landscape — iDEAL in the Netherlands, SEPA and Klarna in Germany, Bizum in Spain, card-dominant in the UK. This fragmentation is well-documented and shows no sign of converging toward one dominant method, which is part of why platform checkout localisation matters as much as pricing. Our how Europeans shop online breakdown covers this country by country.
Returns are a bigger cost driver than most shoppers realise
Fashion’s dominance as the top e-commerce category comes with a structural cost: it’s also the category with the highest return rate, by a wide margin, since sizing can’t be verified before delivery the way it can in a physical store. Platforms handle this differently — some absorb return shipping as a cost of doing business, others pass it back to the shopper — and that difference shows up in pricing even when it isn’t obvious at checkout. It’s part of why comparing “price” alone between platforms can be misleading without also checking the return policy behind it.
What the numbers mean for shoppers, not just analysts
The practical takeaway from all of this: the platforms growing fastest (Temu, AliExpress, Shein) are growing specifically because they solved the cross-border VAT and shipping-cost predictability problem better than smaller sellers did — which is also exactly why the deals on those platforms tend to be more stable and trackable than the scattered discounts you’d find hunting individual small sellers. It’s a big part of why our best shopping websites comparison leans on these platforms specifically.
FAQ
Is e-commerce still growing in Europe or has it plateaued? Still growing, with cross-border purchases growing faster than domestic e-commerce — largely driven by factory-direct platforms with EU warehouse networks.
Which product category dominates European e-commerce? Fashion remains the largest category by transaction volume, followed closely by electronics and home goods.
Why did cross-border shopping shift toward certain platforms? The EU’s VAT policy change closed the low-value import exemption, and platforms with EU-based warehousing (Choice-badge AliExpress, regional Temu stock) adapted faster than smaller independent sellers, capturing a larger share of the resulting volume.
Is mobile or desktop bigger for European online shopping? Mobile dominates browsing traffic in nearly every market. Desktop retains a meaningful share of actual checkout completion for higher-value purchases specifically.
We track live pricing and shipping data across every platform and country — see our UK Temu page for the current numbers behind the headline trend.